The Outlook for 2024-26
We expect global equities to deliver only modestly positive returns over the next three years. Our estimates are not miles from actual returns over the last 122 years. It is only because returns have been so extraordinarily high over the last 35 years that our projected returns look rather uninspiring. The reason? Read on for the answer.
Open this issue (PDF)Preview
There will be obstacles. There will be doubters. There will be mistakes. But with hard work, there are no limits.
Preface
Recently, I was asked by a client what my return expectations are for the next three years. The client is British and asked me to provide two estimates – one for UK equities and one for equities worldwide. The following is a summary of my response to him. As most of our readers are not British, in the following, I will focus on our global outlook; however, at the very end, I will provide a brief explanation why I expect UK equities to do better than global equities over the next few years.
Before tackling this month’s topic, I would like to briefly mention that, only a few days ago, we launched a new megatrend-focused investment vehicle. As most of you will be aware, our approach to investing is very thematic. Seven megatrends (which you can read more about here) drive our investment strategy, and our new investment vehicle will focus on themes linked to those megatrends; however, I also ought to mention that the new investment vehicle is an Alternative Investment Fund (AIF), meaning that it is not open to retail investors. That said, if you would like to receive further information, feel free to contact us.

The economic logic behind our stance
Now to the main topic. Financial markets always affect household wealth at the aggregate level, and I believe the impact could be noticeable over the next few years. Household wealth is the sum (ex. debt) of property wealth, pension savings, the value of direct financial investments and non-financial investments – e.g. family-owned businesses. In the following, I will only look at financial investments made in public markets, as that is where the majority of our readers have most of their capital invested.
Household wealth has been under pressure over the last couple of years, and I believe it will continue to be under pressure in the years to come (Exhibit 1). Having said that, there is no theoretical model which can be used to predict which of the four components of household wealth mentioned above that will contribute the most to the overall loss of wealth. One has to apply other techniques – e.g. how expensive is the asset class in question?

Sources: St. Louis Federal Reserve Bank, Absolute Return Partners LLP
When I believe household wealth is under pressure and will continue to be so, it is because it is long-term stable when measured nationwide and calculated as a percentage of GDP. The long-term mean value of wealth-to-GDP worldwide is about four times, i.e. wealth is about four times larger than GDP worldwide when the global economy is well-balanced; however, wealth-to-GDP is currently well above its long term mean value in most countries – very much a function of the very benign monetary policy conducted in most countries in recent years.
Wealth-to-GDP is not exactly the same everywhere, as the ratio is affected by how efficiently capital is deployed in the country in question. The long-term mean value in the most capital-efficient country in the world, the USA, is about 3.8 times. Think of wealth as the capital available for the economy to grow and think of GDP as the output in the economy. Wealth-to-GDP is thus a measure of how much capital it takes to grow the economy by $1 and, the more capital-efficient a country is, the lower the wealth-to-GDP ratio is.
Now, because of years (decades) of falling interest rates and upbeat equity and property markets, wealth has exploded, and wealth-to-GDP is now well above its long-term mean value in most countries. In the most extreme case, the USA, the ratio stands at 5.7 times, 50% above its long-term mean value. In plain English, this means that US households may lose 50% of their net worth; however, the theory behind provides no guidance as to the timing of it. Nor does the underlying theory provide any guidance on the role of the numerator vs. the denominator; i.e. the long-term mean value could be reached if the numerator grows more slowly than the denominator for an extended period of time.
The economic theory behind it all is difficult to explain – it is grounded in economic micro theory which is terribly theoretical. However, it is not difficult to understand the underlying logic. In simple terms, wealth cannot continue to grow faster than the economy (nor can it grow more slowly than the economy) for an extended period of time, as wealth creation is a by-product of economic growth. Therefore, over time, ΔWealth/ΔGDP must approximate 1 and, as a consequence, wealth-to-GDP must be long-term stable.
Latest developments on household wealth
Since the start of the millennium, real household wealth has shrunk in only two years – 2008 and 2022. In 2008, the Global Financial Crisis was the culprit whereas, in 2022, inflation was to blame. Last year, inflation turned a gain in nominal wealth of 3.4% worldwide into a loss of 2.6% in real terms (Exhibit 2).

Note: Exchange rates have been smoothed
Source: UBS
Moving on to Exhibit 3, as you can see, North American households took the biggest hit last year. Total wealth in the region declined by 4.5%. Meanwhile, European wealth dropped by 3.4%. That said, I should point out that European households lost more on their financial assets last year than US household did – 10.4% vs. 9.0%. In $-terms, between North America and Europe, $10.9Tn of wealth was lost last year.

Source: UBS
I reckon that the bigger loss of financial wealth in Europe last year had to do with the more widespread ownership of bonds in this part of the world. As the year progressed, bond yields rose, leading to significant losses in bond portfolios all over the world but particularly in those parts of Europe where bond ownership is widespread. Take a look at Exhibit 4 below and zoom in on the Netherlands. In that country, it is not uncommon to hold over 50% of your financial assets in bonds. Then look at Germany which is a savings-minded country, and that served German households well last year. As you can see, the average German adult lost ‘only’ $14,360 in 2022.
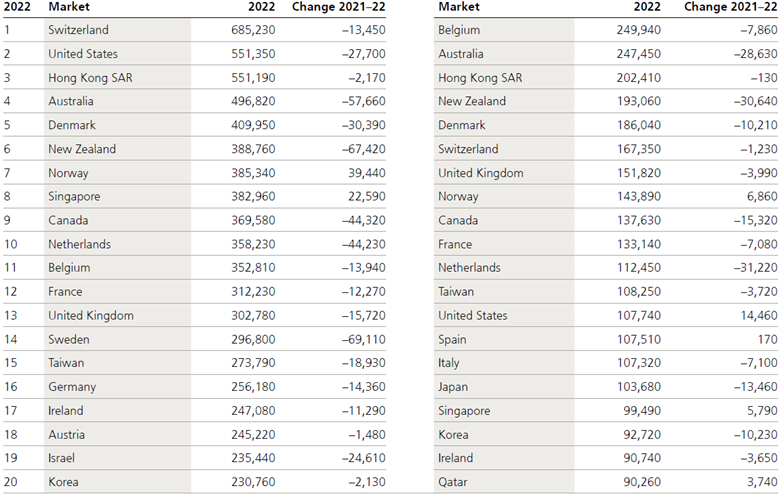
Source: UBS
As far as the UK is concerned, it is probably fair to say that UK households tend to invest less in bonds than many other European households do. Adding to that, in 2022, UK equities turned into a risk-off asset class, which caused UK equities to suffer less than most other equity markets. The combination of the two resulted in UK household wealth holding up better than household wealth in many other European countries last year.
The outlook
At the most basic level, only two factors drive GDP growth – workforce growth and productivity growth. The impact from a shrinking workforce on GDP growth will be increasingly dramatic in the years to come. Meanwhile, productivity will probably improve as a result of the introduction of advanced robotics, AI and other new, groundbreaking technologies. The combination of all those technologies will most likely improve the output per hour worked – the very definition of productivity.
One critical question stands out, and the answer to that question could very well define the overall tone in financial markets in the years to come. Will the rise in productivity be sufficient to offset the negative impact from labour? At this stage, nobody knows the answer to that question, so my response is, at best, a guesstimate. Having said that, early signs are that AI will affect the workforce more dramatically than other tech inventions have done. Up to this point, new technologies have cost few jobs, as long as the workers affected have been prepared to undertake additional training. AI is different. Even workers with university degrees will be at risk from it.
Therefore, one could argue that the countries likely to benefit the most from AI are those with the most troublesome demographic outlook, as there is little cost to those countries from introducing AI. In a global context, that makes Japan and South Korea look particularly attractive. Within Europe, countries like Germany, Italy and Spain stand out. When assessing the impact of AI from this angle, countries like the UK and USA, which both enjoy a much more attractive demographic outlook, could be on the losing side, as unions may fight hard to protect jobs. If successful, they will probably struggle to remain competitive vis-à-vis countries like Japan and South Korea.
Assuming that many (but not all) equity markets are overvalued at present, that wealth-to-GDP will return to its long-term mean value over the next 10-15 years, and that, overall, AI will struggle to fully make up for the loss in output from a declining global workforce, we expect global equity returns to be relatively modest over the next few years (Exhibit 5). One caveat: When projecting that wealth-to-GDP will mean-revert, I cannot promise you when it will happen – these trends are long-term in nature. That said, take another look at Exhibit 1. Maybe the mean-reversion process has already commenced?
With that caveat in mind, allow me to share my return expectations with you. As you can see in Exhibit 5, I expect equities, on average, to deliver modest, yet positive, returns over the next three years. Those returns are not miles away from average, annual equity returns over the last 122 years. They only look so uninspiring because we have been spoiled rotten in the great equity bull market of the last 35 years.

Source: Absolute Return Partners
A few words about the UK
As you can see above, I expect UK equities to do better than global equities over the next three years. That is based on an assumption that UK equities will outperform US equities, which have had a fabulous run over the last 35 years. As a result, US equities now account for almost 70% of the MSCI World Index. The phenomenal rise in US equities have had a corresponding effect on US wealth, which is now absurdly high when measured relative to US GDP, meaning that American households are more at risk from the mean-reversion dynamic than most other households are.
I should point out that our total return expectations, i.e. returns from cash, fixed interest, equities, alternatives and commodities combined, are modestly higher than the numbers indicated in Exhibit 5 above. This is due to a combination of factors. 10-year government bonds are now yielding over 4.8% in the US and over 4.5% in the UK – not dramatically different from our expected returns on equities over the next three years. We believe that investors will increasingly be attracted to bonds and that the next bull market is more likely to be in long-dated bonds than in equities.
As far as commodities are concerned, our thematic investment ideas are sometimes easier to express through commodities, which I expect to deliver higher returns than equities in the years to come. I probably don’t need to remind you that the green transition shall require vast amounts of green metals to make it happen. This could result in extraordinarily high returns on certain commodities over the next few years.
Niels C. Jensen
1 November 2023
Investment Megatrends
Our investment philosophy, and everything we do at ARP, is driven by the long-term Investment Megatrends which are identified and routinely debated by our investment team.
Related Investment Megatrends
Our investment philosophy, and everything we do at ARP, is driven by the long-term Investment Megatrends which are identified and routinely debated by our investment team. Read more about related Megatrend/s for this article:
About the Author